

Figures D14 to D38
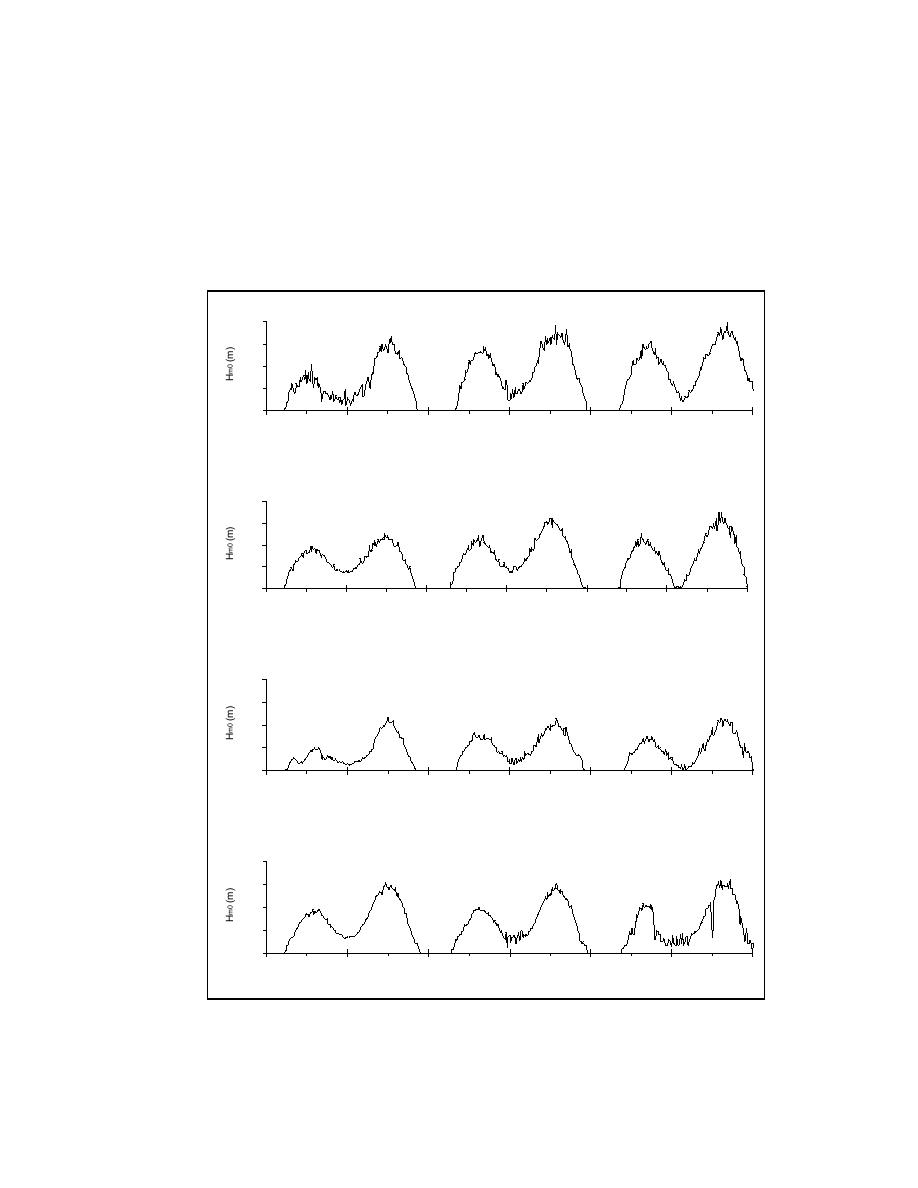
This section contains plots of time series of significant wave height, peak
period, wave direction, easting and northing velocity, and suspended sediment
concentration from sta OS 1-6, 2001 and OS 8-9, DP 1-2, 2002.
Deployment 1
2.0
OS 1
1.5
1.0
0.5
0.0
2/6/01 0:00
2/6/01 12:00
2/7/01 0:00
2/7/01 12:00
2/8/01 0:00
2/8/01 12:00
2/9/01
2.0
OS 2
1.5
1.0
0.5
0.0
2/6/01 0:00
2/6/01 12:00
2/7/01 0:00
2/7/01 12:00
2/8/01 0:00
2/8/01 12:00
2/9/01 0
2.0
OS 3
1.5
1.0
0.5
0.0
2/6/01 0:00
2/6/01 12:00
2/7/01 0:00
2/7/01 12:00
2/8/01 0:00
2/8/01 12:00
2/9/01
2.0
OS 4
1.5
1.0
0.5
0.0
2/6/01 0:00
2/6/01 12:00
2/7/01 0:00
2/7/01 12:00
2/8/01 0:00
2/8/01 12:00
2/9/01
Figure D14.
SIDSEP wave height measurements, Deployment 1, 6-9 February
2001
D25
Appendix D Field Data Collection

 Previous Page
