

Figures D10 to D13
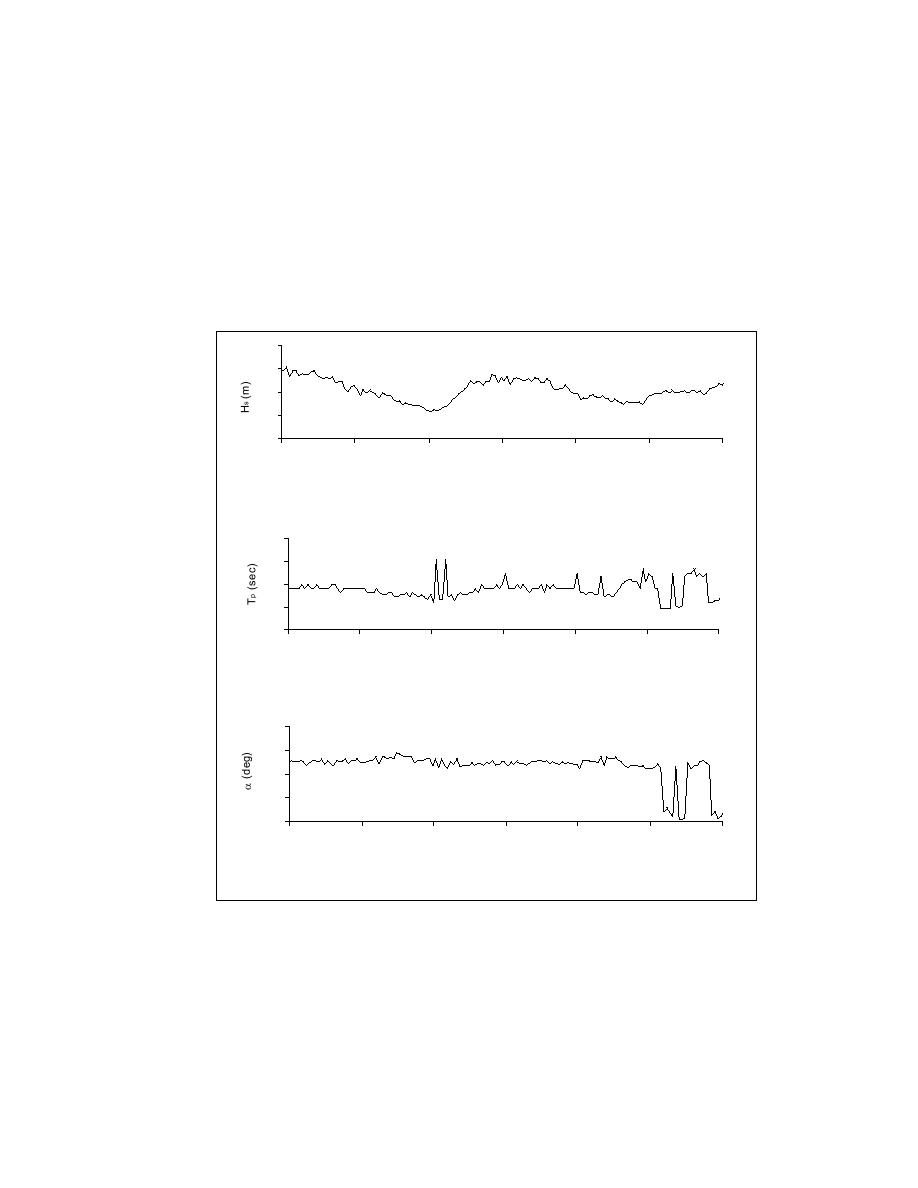
This section contains plots of time series of significant wave height, peak
period and direction measured at Grays Harbor CDIP buoy (3601) during
instrument deployments (February, March, and May 2001 and March, April, and
May 2002).
4
Grays Harbor CDIP Buoy
3
2
1
0
2/6/01
2/6/01
2/7/01
2/7/01
2/8/01
2/8/01
2/9/01
20
15
10
5
0
2/6/01
2/6/01
2/7/01
2/7/01
2/8/01
2/8/01
2/9/01
360
315
270
225
180
2/6/01
2/6/01
2/7/01
2/7/01
2/8/01
2/8/01
2/9/01
Figure D10. SIDSEP Deployment 1, 6-9 February 2001
D21
Appendix D Field Data Collection

 Previous Page
