

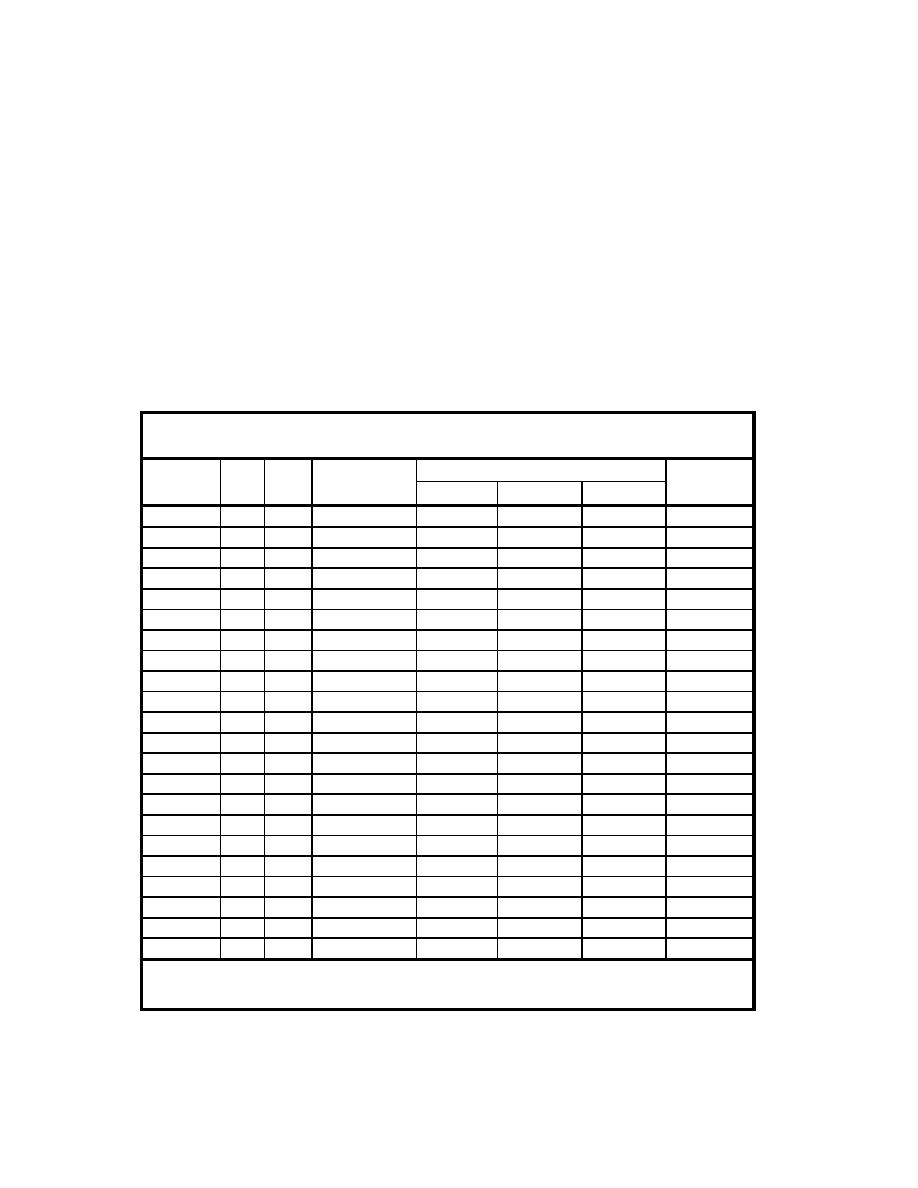
coefficients are summarized in Table D3. In processing the measured time
series, the calibration formula was applied to each "instantaneous" sample of
sensor "counts" to convert OBS data to suspended sediment concentration in
grams per liter.
Data Recovery
Data recovered from all instrumentation deployed on the SIDSEP and
HESTT are summarized in Table D4. Table D4 shows the deployments and
recovery times for the deployments as well as the total amount of recorded and
processed data. Pressure data loss occurred as a result of instrument emergence
at low tide. Velocity data loss occurred as a result of sensor motion and
instrument emergence at low tide. HESTT sta OS 7 was not recovered.
Table D3
OBS Calibration Results (2001/2002)
Calibration Coefficients for 0-24 g/L Range
Station Serial
Elevation Above
2
R
Deployment No.
No.
Bed (m)
A
B
C
3
OS 5
1408
0.25
2.426949E-09 3.077946E-04 -4.565425E-01 9.939048E-01
1, 2, 3
OS 1
1407
0.15
3.551526E-09 5.334601E-04 -3.856765E-01 9.997643E-01
3
OS 6
1405
0.25
2.697483E-09 2.031709E-04 -5.407930E-02 9.998382E-01
1, 2, 3
OS 1
1404
0.35
4.036252E-09 5.126042E-04 -3.682450E-01 9.992964E-01
1, 3
OS 2
1403
0.35
3.988815E-09 5.295308E-04 -2.384312E-01 9.999436E-01
1, 3
OS 2
1402
0.15
1.529892E-09 6.022695E-04 -4.643728E-01 9.997717E-01
1, 3
OS 3
1401
0.15
1.999875E-09 5.789079E-04 -5.981259E-01 9.990675E-01
1, 3
OS 3
1400
0.35
3.300025E-09 5.162753E-04 -3.977704E-01 9.994902E-01
1, 3
OS 4
1399
0.15
3.760698E-09 5.007529E-04 -4.960281E-01 9.996216E-01
1, 3
OS 4
1398
0.35
3.159039E-09 5.422607E-04 -6.163681E-01 9.995151E-01
2
OS 2
1399
0.15
3.760698E-09 5.007529E-04 -4.960281E-01 9.996216E-01
2
OS 2
1398
0.35
3.159039E-09 5.422607E-04 -6.163681E-01 9.995151E-01
3
OS 6
1397
0.45
2.873761E-09 2.006019E-04 -6.002029E-02 9.998503E-01
3
OS 5
1396
0.45
5.281074E-09 2.373572E-04 -3.549462E-03 9.989898E-01
1 (2002)
OS 8
1396
0.45
3.0378E-09
1.3080E-04
7.2474E-02
9.9696E-01
1 (2002)
OS 8
1409
0.30
2.0852E-09
1.4803E-04
3.5401E-02
9.9831E-01
1 (2002)
OS 9
1398
0.45
3.1242E-09
1.2599E-04
7.7119E-02
9.9914E-01
1 (2002)
OS 9
1399
0.30
3.2116E-09
1.2123E-04
6.4162E-02
9.9842E-01
1 (2002)
DP 1
1403
0.35
-3.0908E-10
4.1389E-04
-7.6709E-01
9.8815E-01
1 (2002)
DP 1
1406
0.50
-1.4420E-10
3.9452E-04
-7.1883E-01
9.8955E-01
1 (2002)
DP 1
1402
0.35
4.2812E-10
3.5737E-04
-5.5125E-01
9.9422E-01
1 (2002)
DP 2
1404
0.50
1.9600E-10
3.7711E-04
-5.4821E-01
9.9404E-01
2
Calibration Formula: y = Ax + Bx + C.
Where y is suspended sediment concentration in g/L, x is OBS sensor "counts", and A, B, and C are calibration
coefficients.
D14
Appendix D
Field Data Collection

 Previous Page
