

target armor layer. The sublayer was modeled for the armor layer stones. For all
subsequent tests, a closer match to the armor layer gradation was obtained using
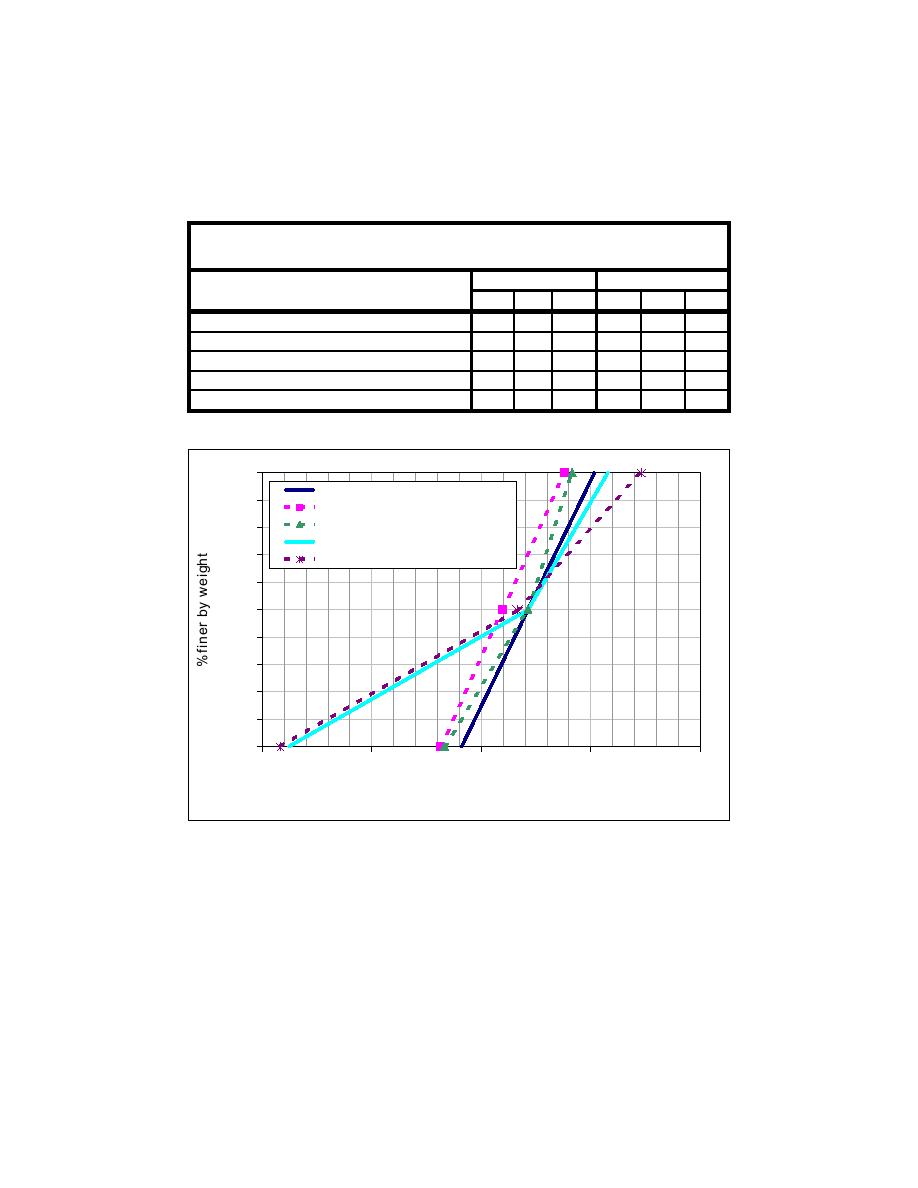
hand-picked stones, and the sublayer was modeled using a mechanically sorted
gradation which provided a reasonably close match. These gradations are shown
graphically (in full-scale units) in Figure A14.
Table A2
Armor Gradations Used in Model
Model M (grams)
Full-scale W (lb)
Armor Type
M50
Mmax
Wmin
W50
Wmax
Mmin
Target from PI Engineering
104
138
166
1820
2426
3033
Armor layer for test series A
98
132
166
1630
2196
2761
Hand-picked upper armor (Tests B onward)
100
138
160
1664
2426
2828
Sublayer as specified by PI Engineering
14
138
180
243
2426
3154
Sublayer used in model (Tests B onward)
10
140
208
166
2329
3460
100%
Target from PI Engg.
90%
Armor layer for test series A
80%
Hand-picked Upper Armor (Tests B onward)
Sublayer as specified by PI Engg.
70%
Sublayer used in model (Tests B onward)
60%
50%
40%
30%
20%
10%
0%
0
1000
2000
3000
4000
W [lbs]
Figure A14. Stone gradations
Bathymetry
The bathymetry at the north jetty varies considerably. In cases where the
wave height is large relative to the local water depth, depth-limited breaking can
reduce wave height. Over a flat bottom, once wave breaking is initiated, energy
will generally be lost through whitecapping and turbulence until the wave height
is reduced to about half the water depth. The rate of energy dissipation varies
considerably with offshore slope. In general, a steep offshore slope can create
worse wave conditions than a mild one. For the Grays Harbor site, an analysis
A18
Appendix A
Stability Analysis of a Submerged Spur, North Jetty, Grays Harbor, WA

 Previous Page
