

Wave data are available from a buoy seaward of Grays Harbor that has been
operating since 1982 (Coastal Data Information Program 2000). The buoy is
located approximately 1 km southwest from the entrance to Grays Harbor in a
water depth of 41.5 m. Measurements from the buoy from 1993 to 2001 have
been analyzed previously in an engineering report for nearby Willapa Bay (Kraus
2000; Kraus, Arden, and Simpson 2002). Also, PI Engineering has conducted an
extremal analysis of the wave height data from 1982-2000 to document existing
conditions for spur dike feasibility (PI Engineering 2000) and from 1982-2002 as
part of the north jetty O&M study (Chapter 4).
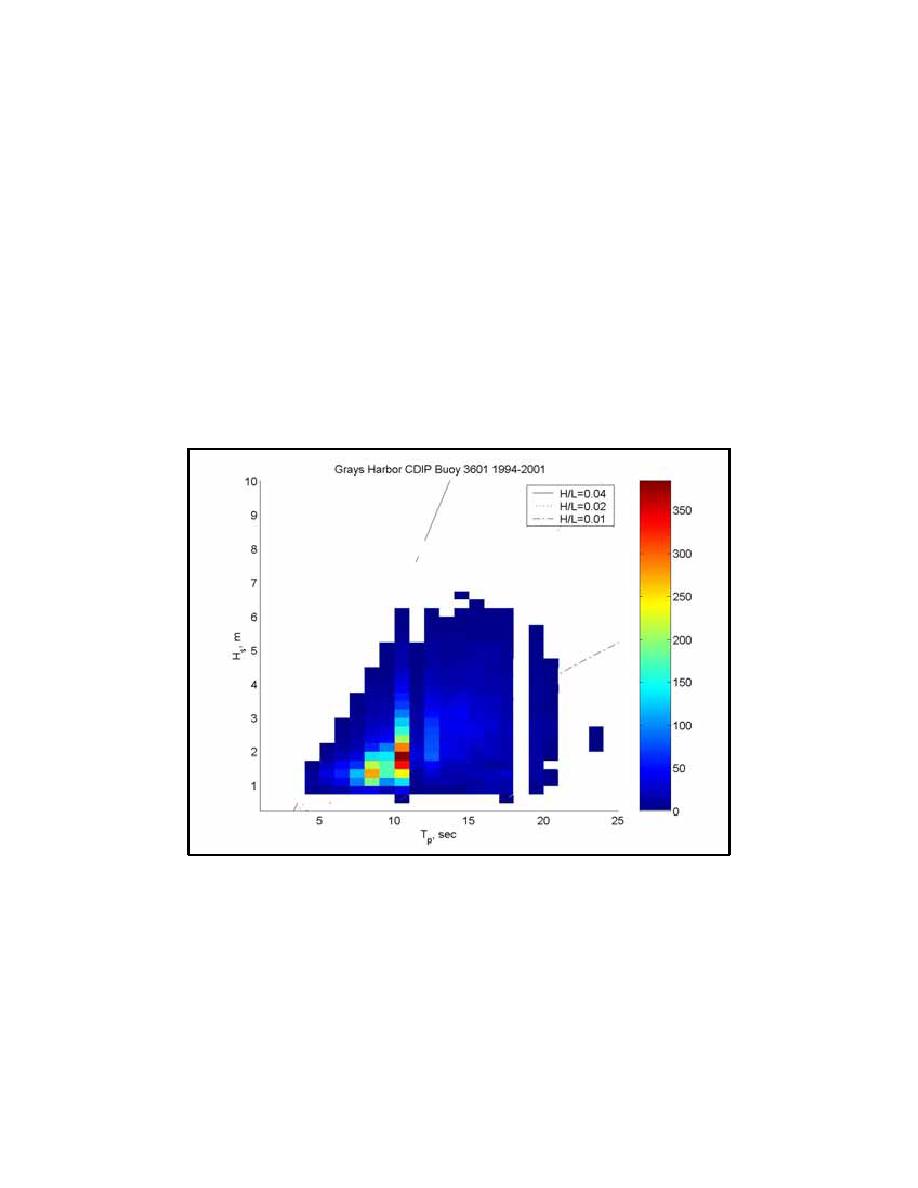
The joint distribution of wave heights and periods measured at the CDIP
buoy is summarized in Figure A3. The plot represents all measured wave heights
and corresponding wave periods offshore of Grays Harbor (CDIP buoy 3601)
over the period January 1994 through December 2001. The distribution shows a
concentration of extreme waves with significant heights, Hs, larger than 6 m at
peak periods, Tp, of 10-15 sec and also of waves longer than 15 sec at somewhat
lower wave heights.
Figure A3.
Joint distribution of Hs and Tp for measurements at Grays Harbor
CDIP buoy 3601 between January 1994 and December 2001. Color
scale represents number of hours per year. Diagonal lines represent
lines of constant wave steepness (H/L), where L is local wavelength
The Hs-Tp occurrence presented in Figure A3 can be extended to an expected
submerged structure. The resulting data set expressing the hours of occurrence
for each Hs-Tp combination is presented in Figure A4. Figure A4 reveals that
durations longer than 4 hr are associated with Hs greater than 7 m, and Tp of 16 to
18 sec. For Tp between 20 and 21 sec, the associated Hs decreases to between 5 m
A4
Appendix A
Stability Analysis of a Submerged Spur, North Jetty, Grays Harbor, WA

 Previous Page
