Home
Download PDF
Order CD-ROM
Order in Print
Home
>
Coastal and Hydraulics Laboratory Fact Sheets
>
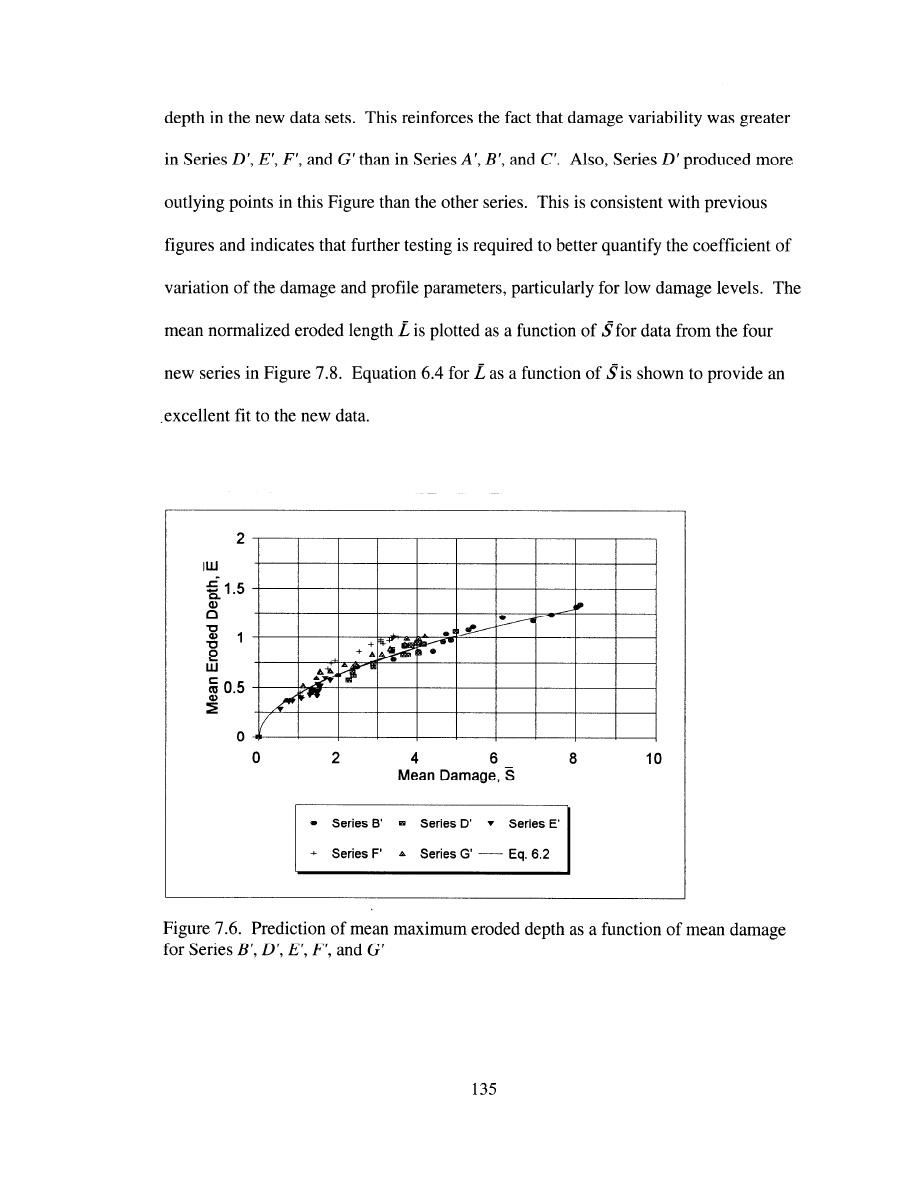
> Figure 7.6 Prediction of mean maximum eroded depth as afunction of mean damage for Series B', D', E', F', ang G'
Figure 7.5 Prediction of damage variability, characterized by the standard deviation, as a function of mean damage for Series B', D', E', F', and G'
Figure 7.7 Prediction of standard deviation of maximum eroded depth as a function of mean damage for Series B', D', F', and G'
CHL-99-17
Page Navigation
130
131
132
133
134
135
136
137
138
139
140


 Previous Page
