Typical wave periods for this site are 20 to 6 sec (0.05 to 0.167 Hz). To resolve
this range, 30 frequency bins are used with an initial frequency of 0.02 Hz and a
frequency increment of 0.01 Hz (range of frequencies is 0.02 to 0.31 Hz). The
same frequency range and resolution were used in both the offshore and near-
shore simulations, so no interpolation was required between offshore grid output
spectra and the nearshore grid input spectra. Because the wave propagation
distances on the nearshore grid are relatively short (5 km), source terms are
neglected (IPRP = 1). Wave-current interaction, though, is significant near the
inlet, so ICUR = 1 to include wave-current interaction was selected. Breaker
indices and radiation stress gradients are saved (IBREAK = 1 and IRS = 1).
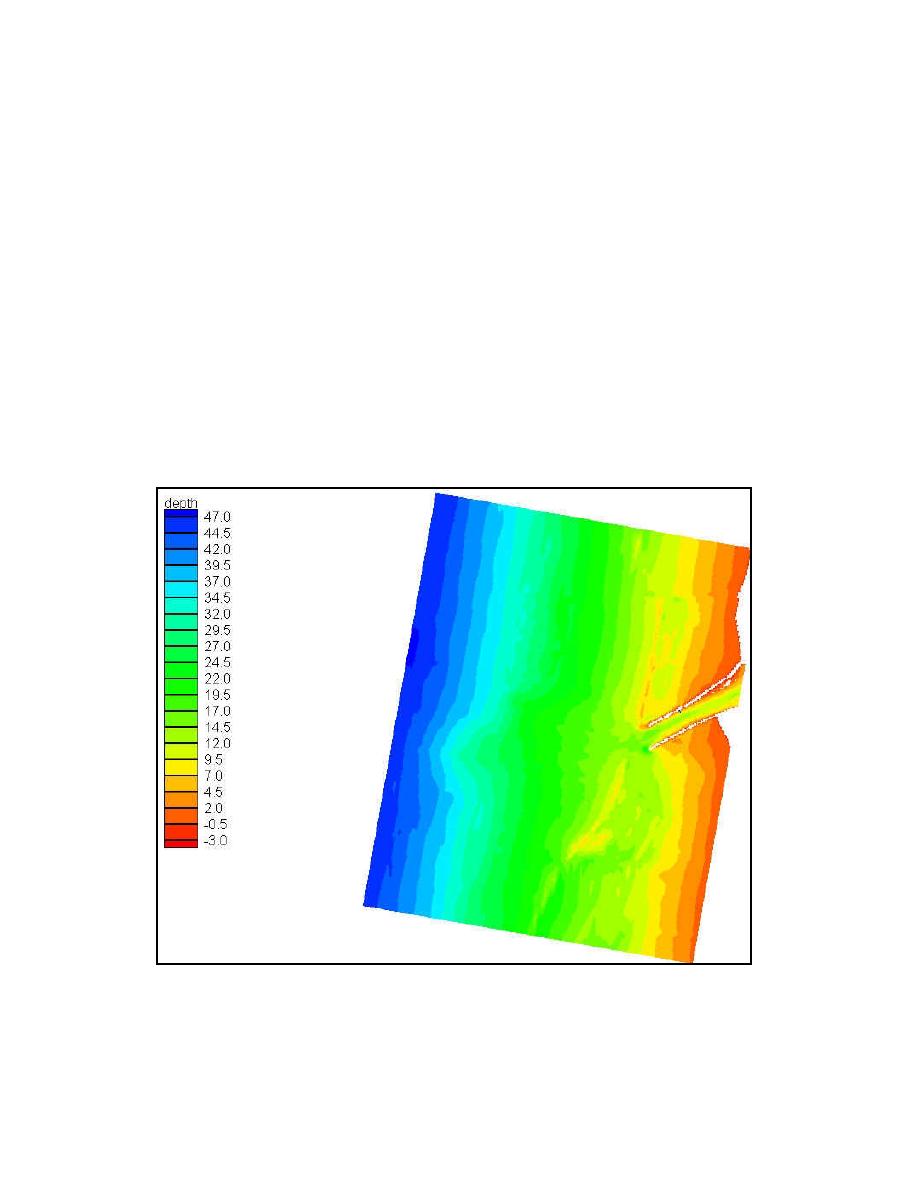
Bathymetry. The bathymetry contours for Yaquina Bay are shown in
Figure 19. The grid was developed using the SMS grid generator as presented in
Chapter 5. The Portland District provided high-resolution bathymetry near the
entrance from multibeam fathometry. These data were supplemented with
NOAA bathymetry and shorelines. The Yaquina jetties are represented in the
model as a series of land cells. The jetty is specified as being three grid cells
wide, which is wider than the real structure. Three cells are required to block
wave energy from propagating through the structure.
Figure 19. Nearshore Yaquina Bay Entrance bathymetry (from SMS)
60
Chapter 6 Example Applications


 Previous Page
