Home
Download PDF
Order CD-ROM
Order in Print
Home
>
Coastal and Hydraulics Laboratory Fact Sheets
>
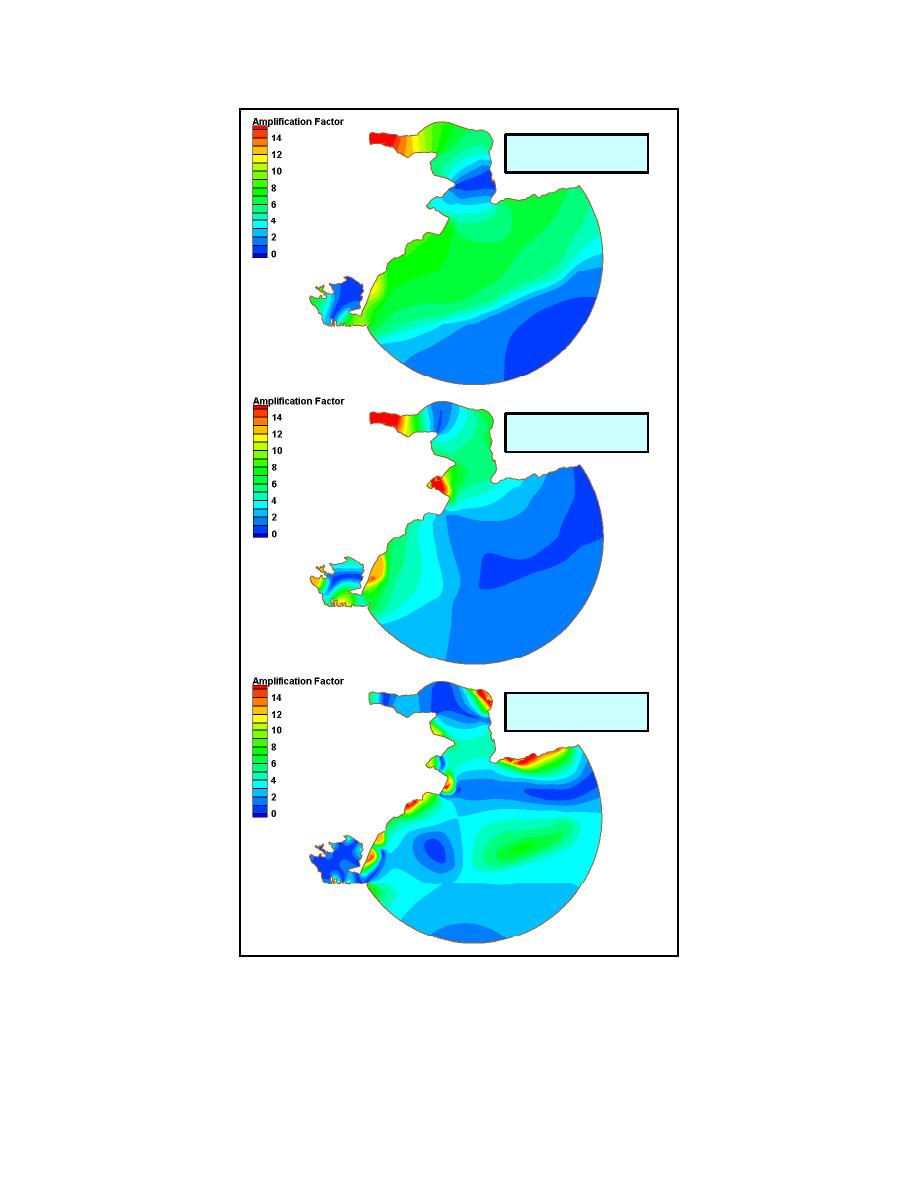
> Figure 19. Resonant longwave amplification factor contours, Peaks 1-3
Figure 18. Longwave response, existing harbor
Figure 20. Resonant longwave amplification factor contours, Peaks 4-6
1_Samoa
Page Navigation
27
28
29
30
31
32
33
34
35
36
37
Peak
1:
T
=
649.4
sec
(
f
=
0.00154
Hz)
Peak
2:
T
=
454.6
sec
(
f
=
0.00220
Hz)
Peak
3:
T
=
235.9
sec
(
f
=
0.00424
Hz)
Figure
19.
Resonant
longwave
amplification
factor
contours,
Peaks
1-3
32
Chapter
5
Harbor
Oscillations


 Previous Page
