

25
Anasosopo
Aua
#2
#9
Leloaloa
Anua
20
#6
#7
#1
#8
#5
15
#3
#4
10
5
0
0.00
0.01
0.02
0.03
0.04
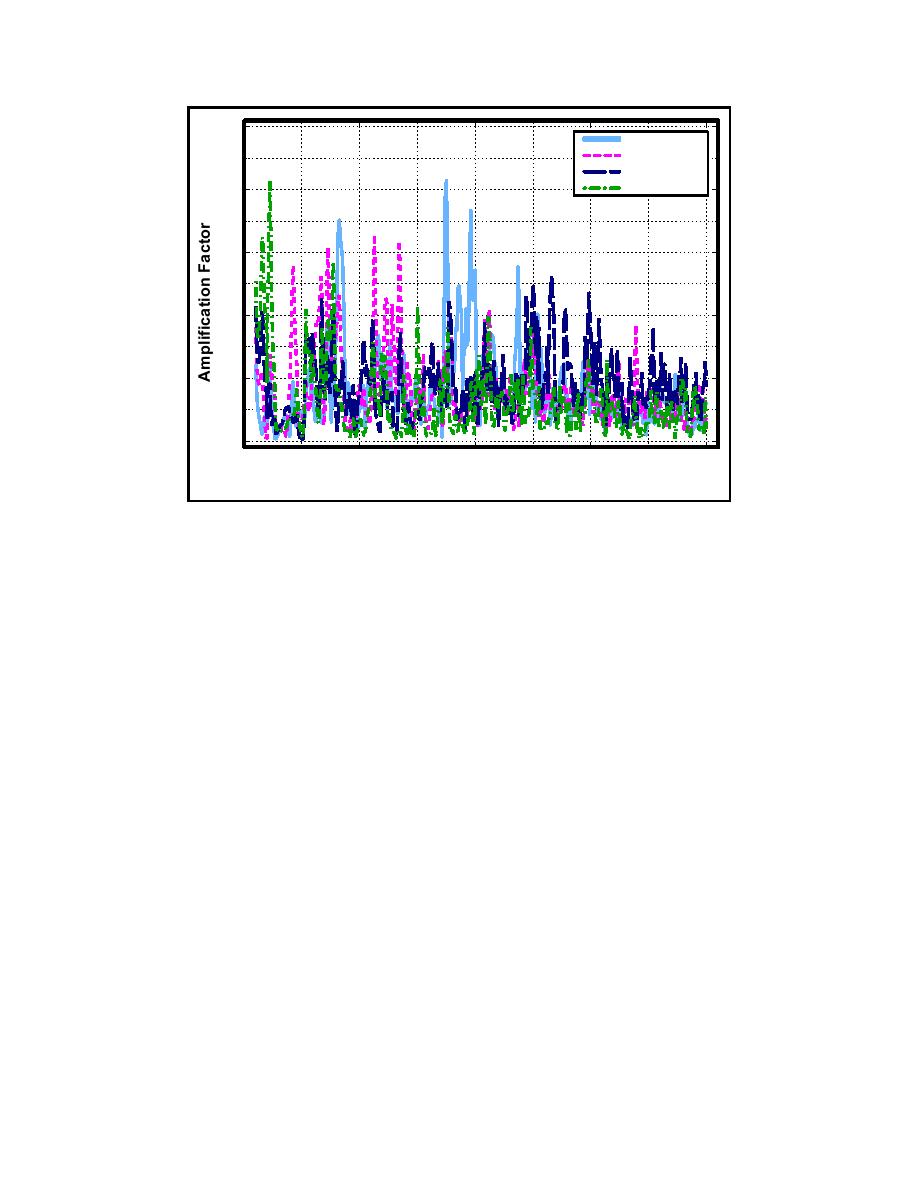
Frequency (Hz)
Figure 18. Longwave response, existing harbor
The shorter period oscillations are more complex patterns. They represent
resonant oscillations between smaller-scale embayment features. For example,
the 235.9-sec resonance (Peak 3) indicates rocking between the area around
Tulutulu Point and the Aua site. The 149.3-sec resonance (Peak 4) suggests four
nodes between the west end of Pago Pago Harbor and the Aua site. The
122.0-sec resonance (Peak 6) shows two nodes between Aua and the notch
between Goat Island Point and Tulutulu Point.
Longwave amplification factors shown here may be overestimated for
resonant peaks at periods less than about 100 sec (0.01-Hz frequency). Wave
reflection coefficient at all solid boundaries was set to 1.0 for all longwave runs,
but comparison of model results to field data in a previous study showed that
peaks at the shorter longwave periods tend to be overestimated (Thompson et al.
1996). Some reduction in reflection coefficient as wave period decreases could
be expected physically. Thompson et al. (1996) demonstrated that even a small
dramatically. With no well-established basis for specific Kr values as a function
of long wave period and no provision in the model for conveniently
incorporating a varying Kr , it was not practical to refine Kr values in this study.
As in previous studies, runs with Kr = 1.0 were considered adequate for
evaluating alternative sites.
31
Chapter 5 Harbor Oscillations


 Previous Page
