

1600
Test 1
Test 3
1400
Test 5
Test 6
1200
1000
800
600
400
200
0
-2
-1
0
1
2
3
4
5
6
7
8
9
10
11
12
13
14
15
16
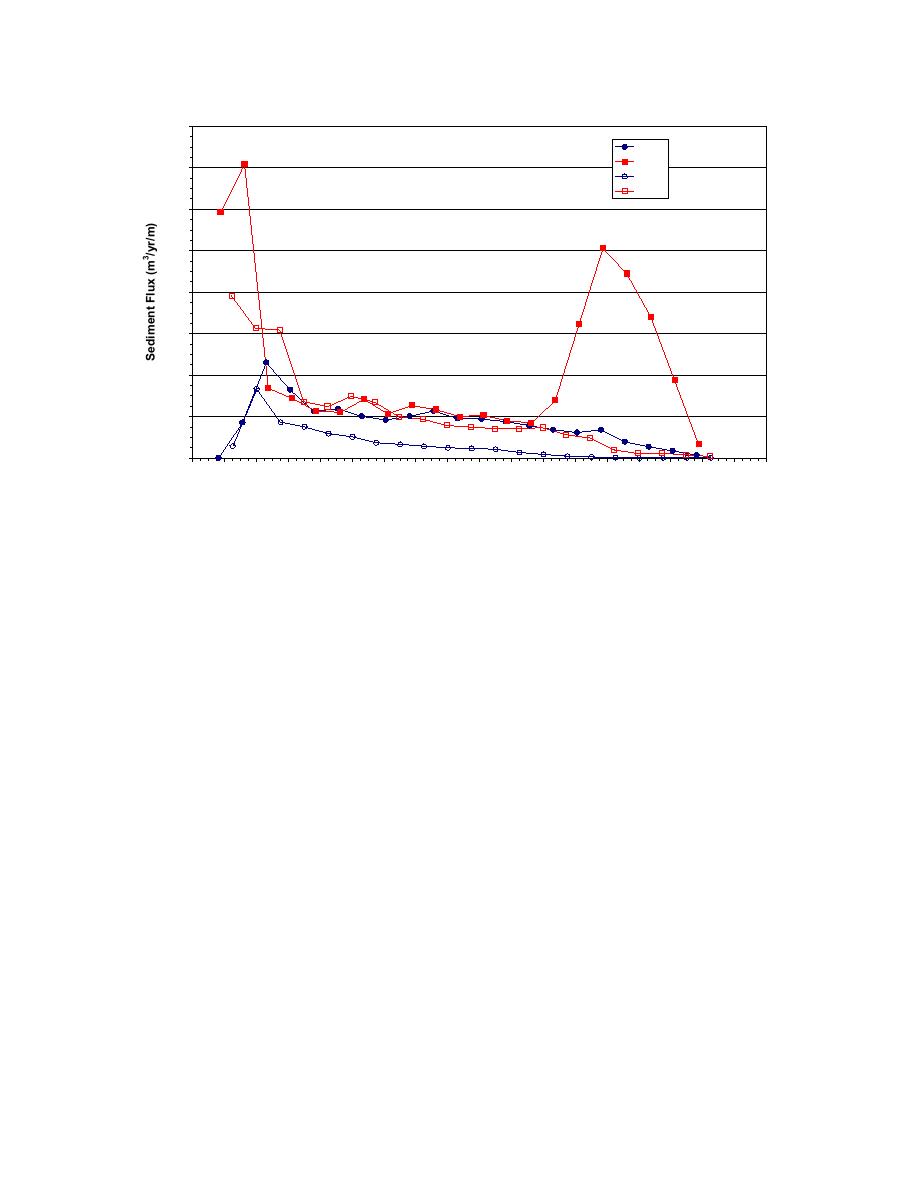
Distance from Shoreline (m)
Fig. 7. Cross-shore distribution of measured longshore sediment transport
Inner Surf Zone
The inner surf zone shows that transport rates are approximately the same for three of the four
cases. In the inner surf, energy is saturated and wave height is strongly controlled by depth. Depths
in the inner surf zone are similar for all experiments, despite differences in incident wave height and
period. Thus, it can be assumed that sediment flux is controlled solely by wave height in this zone
for Tests 1, 3, and 6. It is not apparent why sediment flux measured during Test 5 is lower in the
inner surf than the other three cases. However, Figure 4 shows that waves gradually decrease
through the inner surf for Test 5, and not all waves were observed to break throughout the inner surf
zone. Less wave breaking would produce less turbulence to suspend sand, and could possibly
explain lower sediment flux for Test 5. Further research also will investigate the magnitude of
bottom orbital velocities to determine the frequency at which critical shear stress is reached for
Test 5.
Swash Zone
The swash zone was defined as the region where an increase in foreshore slope was observed
increased, which was within 2 m from the shoreline for the present experiments. There is a peak in
transport in the swash zone for all cases, and Figure 7 shows that swash zone transport has a
dependence on wave period and height, with a stronger dependence on period. In most longshore
sediment transport models the swash transport contribution is either completely ignored or merely
accounted for as part of the total sediment transport budget (Van Wellen et al., 2000). However,
significant swash zone transport rates have been observed in the field (Sawaragi and Deguchi, 1978,
Bodge and Dean, 1987), and swash zone transport can account for up to 50 percent of the total
longshore transport (Elfrink and Baldock, 2002, Van Wellen et al., 2000). For the higher energy
cases (Test 1 and Test 3), swash zone transport accounts for 30 to 40 percent of the total transport.
However, for the lower energy cases (Test 5 and Test 6), swash zone transport accounts for over 60
Smith et al
10

 Previous Page
