

ERDC/CHL CHETN-VII-4
June 2002
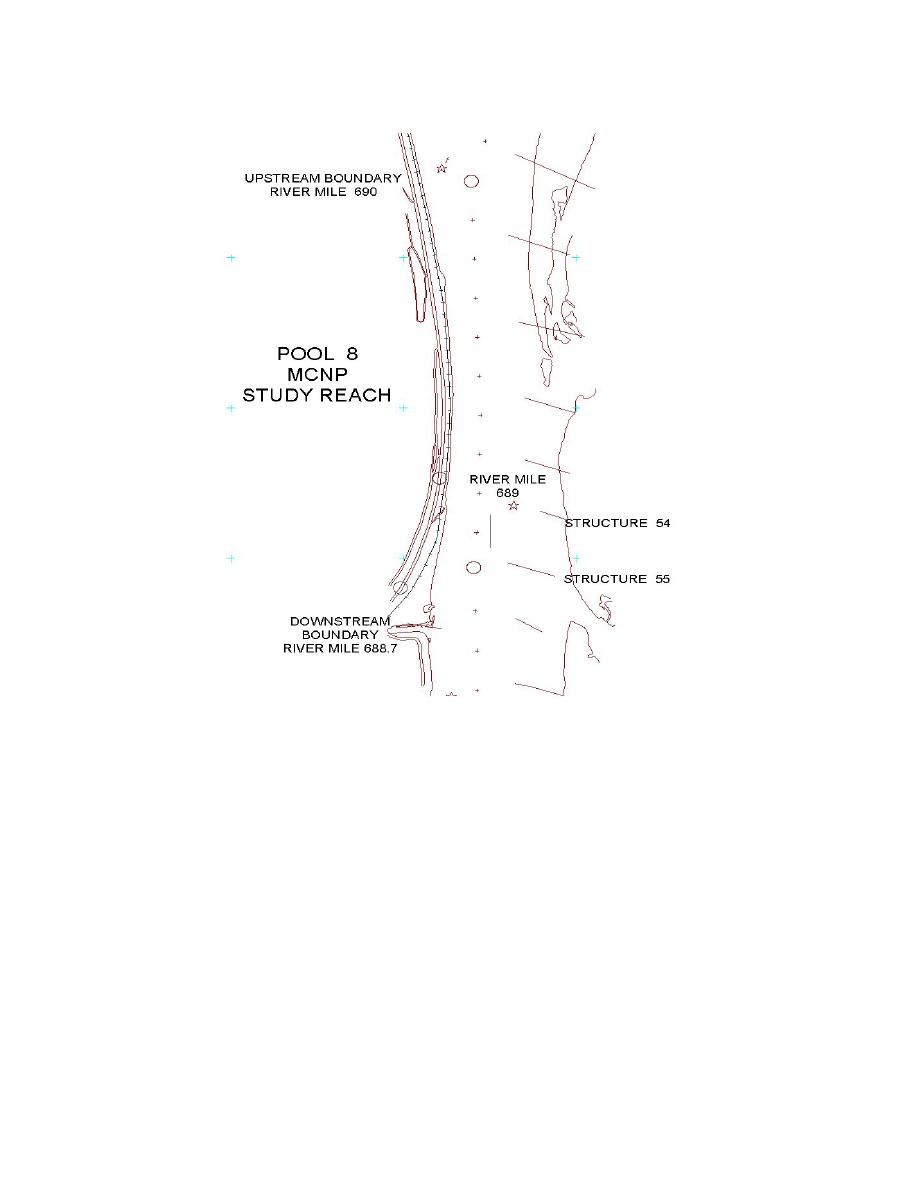
Figure 1. Schematic of study area in Pool 8
The elevation data represented in Figure 6 are very dense. These data are being used in the ISDOT
methodology for quantifying bed-load transport. For example, Figure 7 shows a longitudinal profile
through the north-south swath at four separate times.
This plot shows the longitudinal profile of the four "snapshots" represented by the four swaths. Each
color therefore represents the same wave at different points in time. From this profile the distance
the wave front traveled from time 1 to 2, etc. can be determined and thus the wave celerity. Also,
the basic wave shape and dimensions can be quantified.
The following aerial photos show different views of Pool 8 and the study area.
3

 Previous Page
