Home
Download PDF
Order CD-ROM
Order in Print
Home
>
Coastal and Hydraulics Laboratory Fact Sheets
>
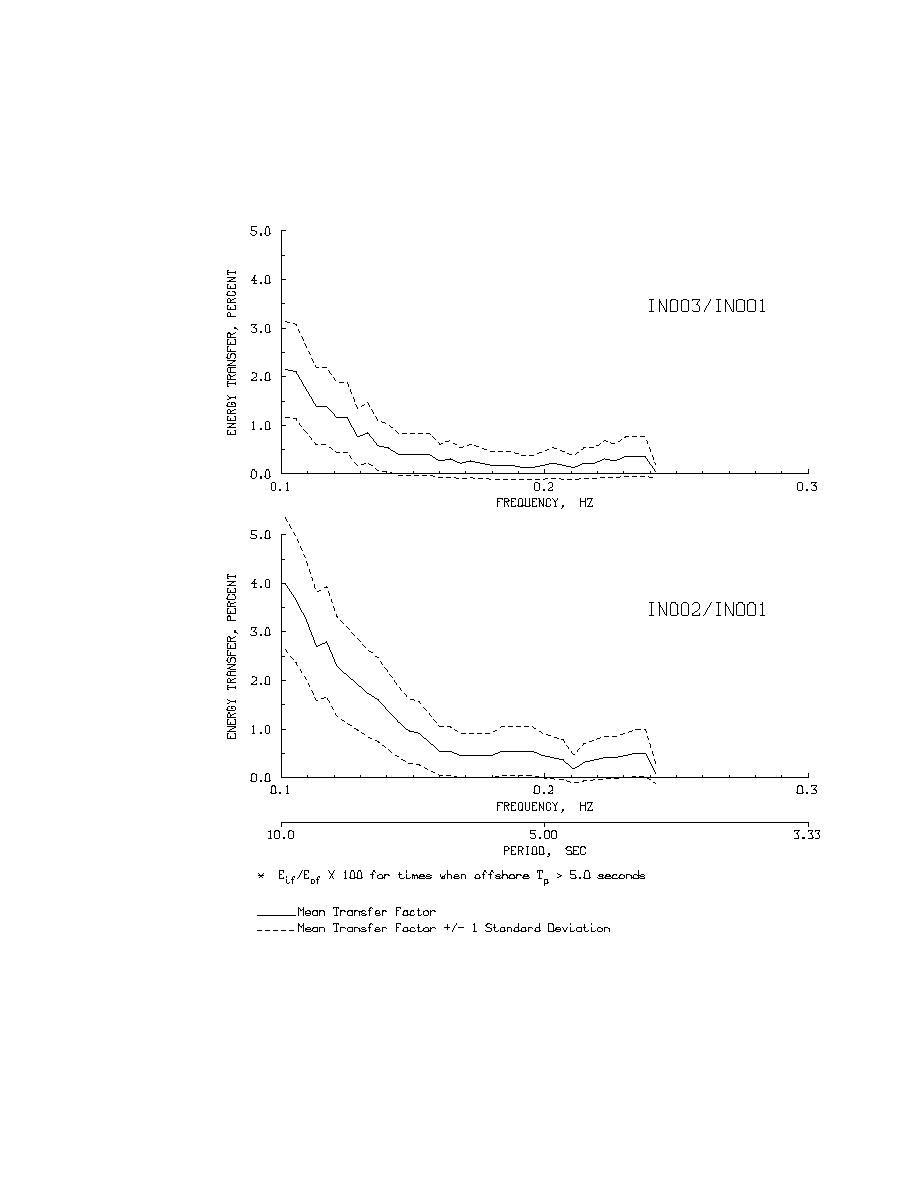
> Figure 9: Bottom Plot: The mean transfer rates for each frequency, <10 seconds, at IN002, for incident wave records with Tp >5 seconds. Top Plot: IN003
Figure 8: Bottom Plot: The mean transfer rates for each frequency at IN002, for incident wave records with Tp> 5 seconds. Top Plot: The mean transfer rates for IN003.
bhbwperf
bhbwperf
Page Navigation
6
7
8
9
10
11
12
Figure
9:
Bottom
Plot:
The
mean
transfer
rates
for
each
frequency
,
<10
seconds,
at
IN002,
for
incident
wave
records
with
T
p
>5
seconds.
The
dashed
line
represents a
one
standard
deviation
band.
Top
Plot:
IN003
11


 Previous Page
