Home
Download PDF
Order CD-ROM
Order in Print
Home
>
Coastal and Hydraulics Laboratory Fact Sheets
>
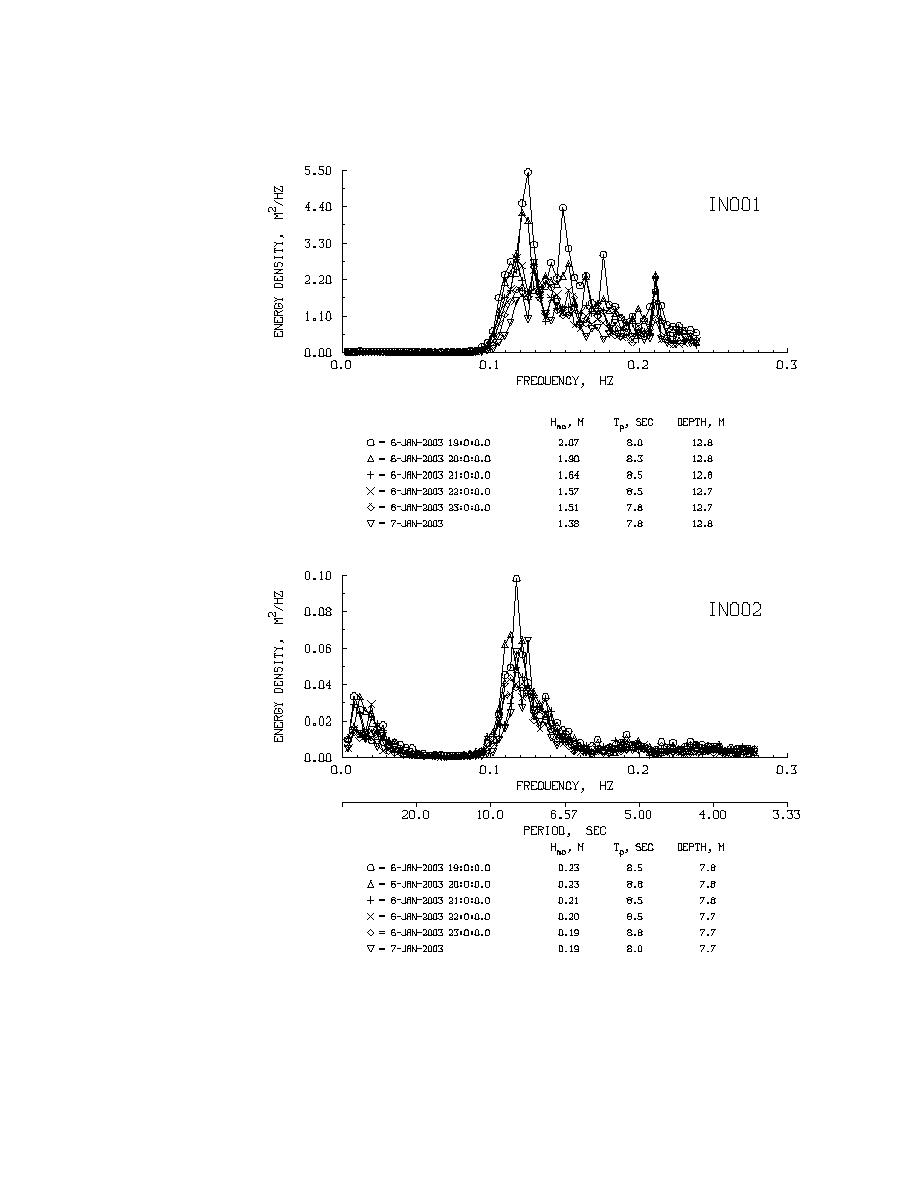
> Figure 3: Top Plot: The next six successive hourly energy spectrums for the incident gage, IN001, located in the open lake. Bottom Plot: Corresponding inside spectrums for IN002.
Figure 2: Top Plot: The next six successive hourly energy spectrums for the incident gage, IN001, located in the open lake. Bottom Plot: Corresponding inside spectrum or IN002
Figure 4: Transfer rates by frequency for the first 6 hours of the storm for gages IN002 and IN003.
bhbwperf
Page Navigation
1
2
3
4
5
6
7
8
9
10
Figure
3:
Top
Plot:
The
next
six
successive
hourly
energy
spectrums
for
the
incident
gage,
IN001,
located
in
the
open
lake.
Bottom
Plot:
Corresponding
inside
spectrums
for
IN002.
5


 Previous Page
