

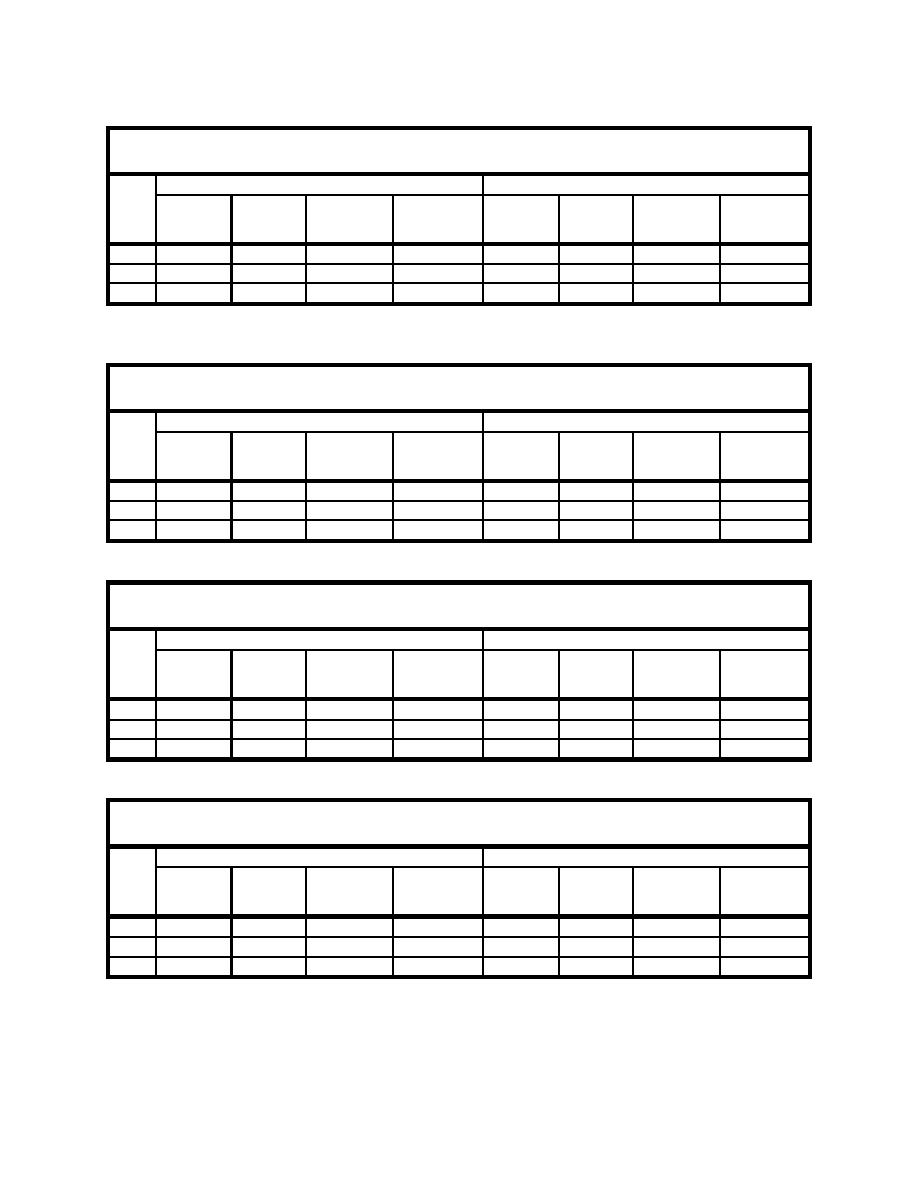
Table B10
Velocity Measurements with 2-m, 9-sec Waves at mllw from West-Northwest
Alternative 1
Alternative 2A
Ave. Vel.
Ave. Vel.
Ave. Vel.
Ave. Vel.
Ave. Vel.
Ave. Vel.
ADV
Offshore
South
of Ave. Vel.
Offshore
South
of Ave. Vel.
No.
(cm/sec)
(cm/sec)
(cm/sec)
(cm/sec)
(cm/sec)
(cm/sec)
(cm/sec)
(cm/sec)
1
-13.17
18.83
45.03
22.98
-23.72
42.32
23.81
2
-20.17
43.78
74.48
48.21
-14.22
50.38
68.64
52.35
3
17.51
57.93
17.65
-2.6
23.25
48.32
23.4
Table B11
Velocity Measurements with 3-m, 13-sec Waves at mllw from West-Northwest
Alternative 1
Alternative 2A
Ave. Vel.
Ave. Vel.
Ave. Vel.
Ave. Vel.
Ave. Vel.
Ave. Vel.
ADV
of Ave. Vel.
South
Offshore
of Ave. Vel.
South
Offshore
No.
(cm/sec)
(cm/sec)
(cm/sec)
(cm/sec)
(cm/sec)
(cm/sec)
(cm/sec)
(cm/sec)
1
-16.82
29.58
66.78
34.03
-35.69
24.44
70.41
43.26
2
-10.24
67.44
93.85
68.21
-12.43
41.87
69.5
43.68
3
75.61
93.84
78.01
-24.92
31.91
65.46
40.48
Table B12
Velocity Measurements with 5-m, 13-sec Waves at mllw from West-Northwest
Alternative 1
Alternative 2A
Ave. Vel.
Ave. Vel.
Ave. Vel.
Ave. Vel.
Ave. Vel.
Ave. Vel.
ADV
Offshore
South
of Ave. Vel.
Offshore
South
of Ave. Vel.
No.
(cm/sec)
(cm/sec)
(cm/sec)
(cm/sec)
(cm/sec)
(cm/sec)
(cm/sec)
(cm/sec)
1
-18.81
66.85
87.64
69.44
-27
50.36
75.13
57.14
2
-18.2
94.21
122.21
95.95
-20.33
46.25
76.32
50.52
3
-22.87
65.21
100.07
69.79
-24.47
38.04
73.94
45.23
Table B13
Velocity Measurements with 2-m, 9-sec Waves at mtl from West-Northwest
Alternative 1
Alternative 2A
Ave. Vel.
Ave. Vel.
Ave. Vel.
Ave. Vel.
Ave. Vel.
Ave. Vel.
ADV
Offshore
South
of Ave. Vel.
Offshore
South
of Ave. Vel.
No.
(cm/sec)
(cm/sec)
(cm/sec)
(cm/sec)
(cm/sec)
(cm/sec)
(cm/sec)
(cm/sec)
1
-15.34
74.20
84.96
75.77
-38.82
80.35
98.92
89.24
2
-37.28
100.16
116.53
106.87
-38.71
81.89
100.33
90.57
3
-26.80
94.20
108.22
97.93
-33.03
84.89
102.33
91.09
B125
Appendix B
Physical Modeling of North Beach and Jetty

 Previous Page
