

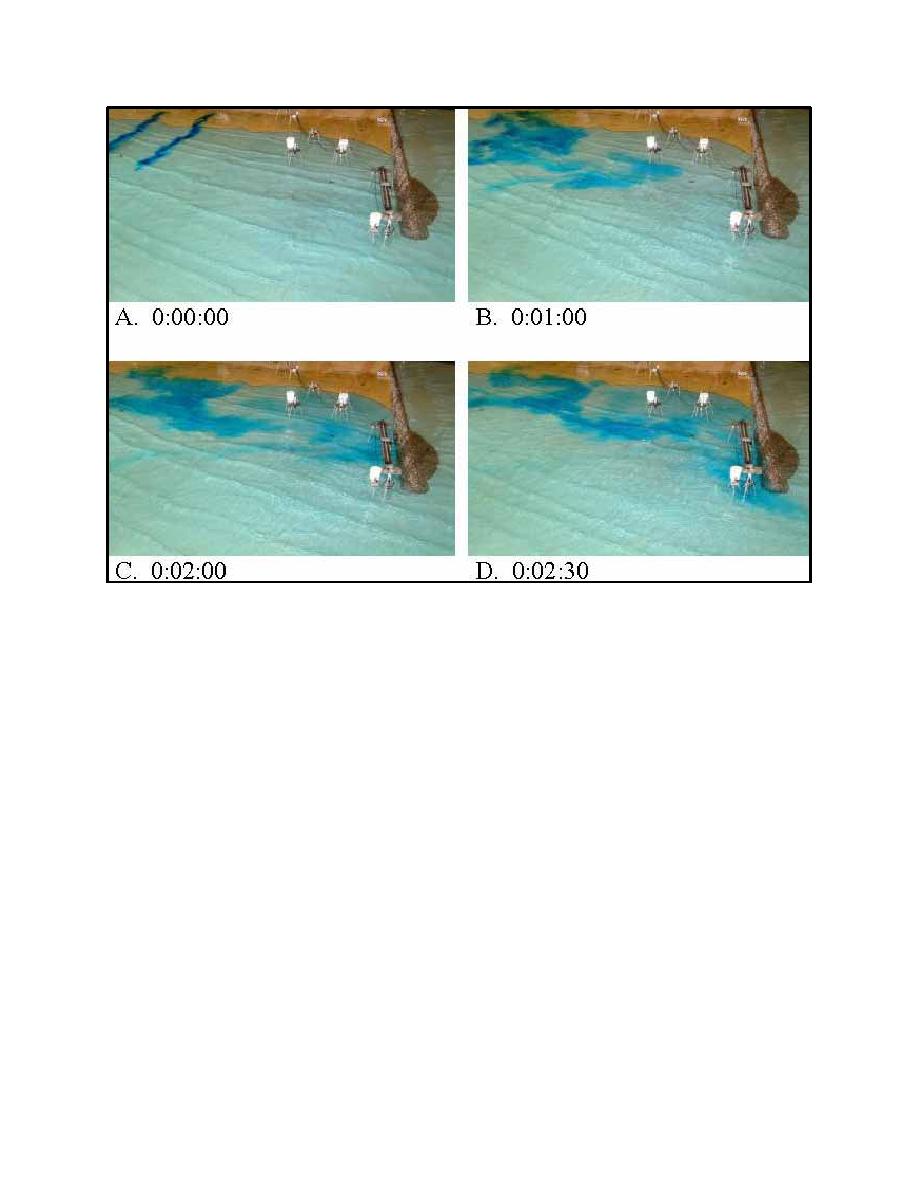
Figure B46. Dye study of Alt 3B for 5-m, 13-sec waves from west-northwest at mhw
Wave heights
Figures B47 through B55 illustrate changes in wave heights with Alt 2A
compared to Alt 1. A negative number indicates waves heights with Alt 2A were
lower than with Alt 1.
B48
Appendix B
Physical Modeling of North Beach and Jetty

 Previous Page
