Home
Download PDF
Order CD-ROM
Order in Print
Home
>
Coastal and Hydraulics Laboratory Fact Sheets
>
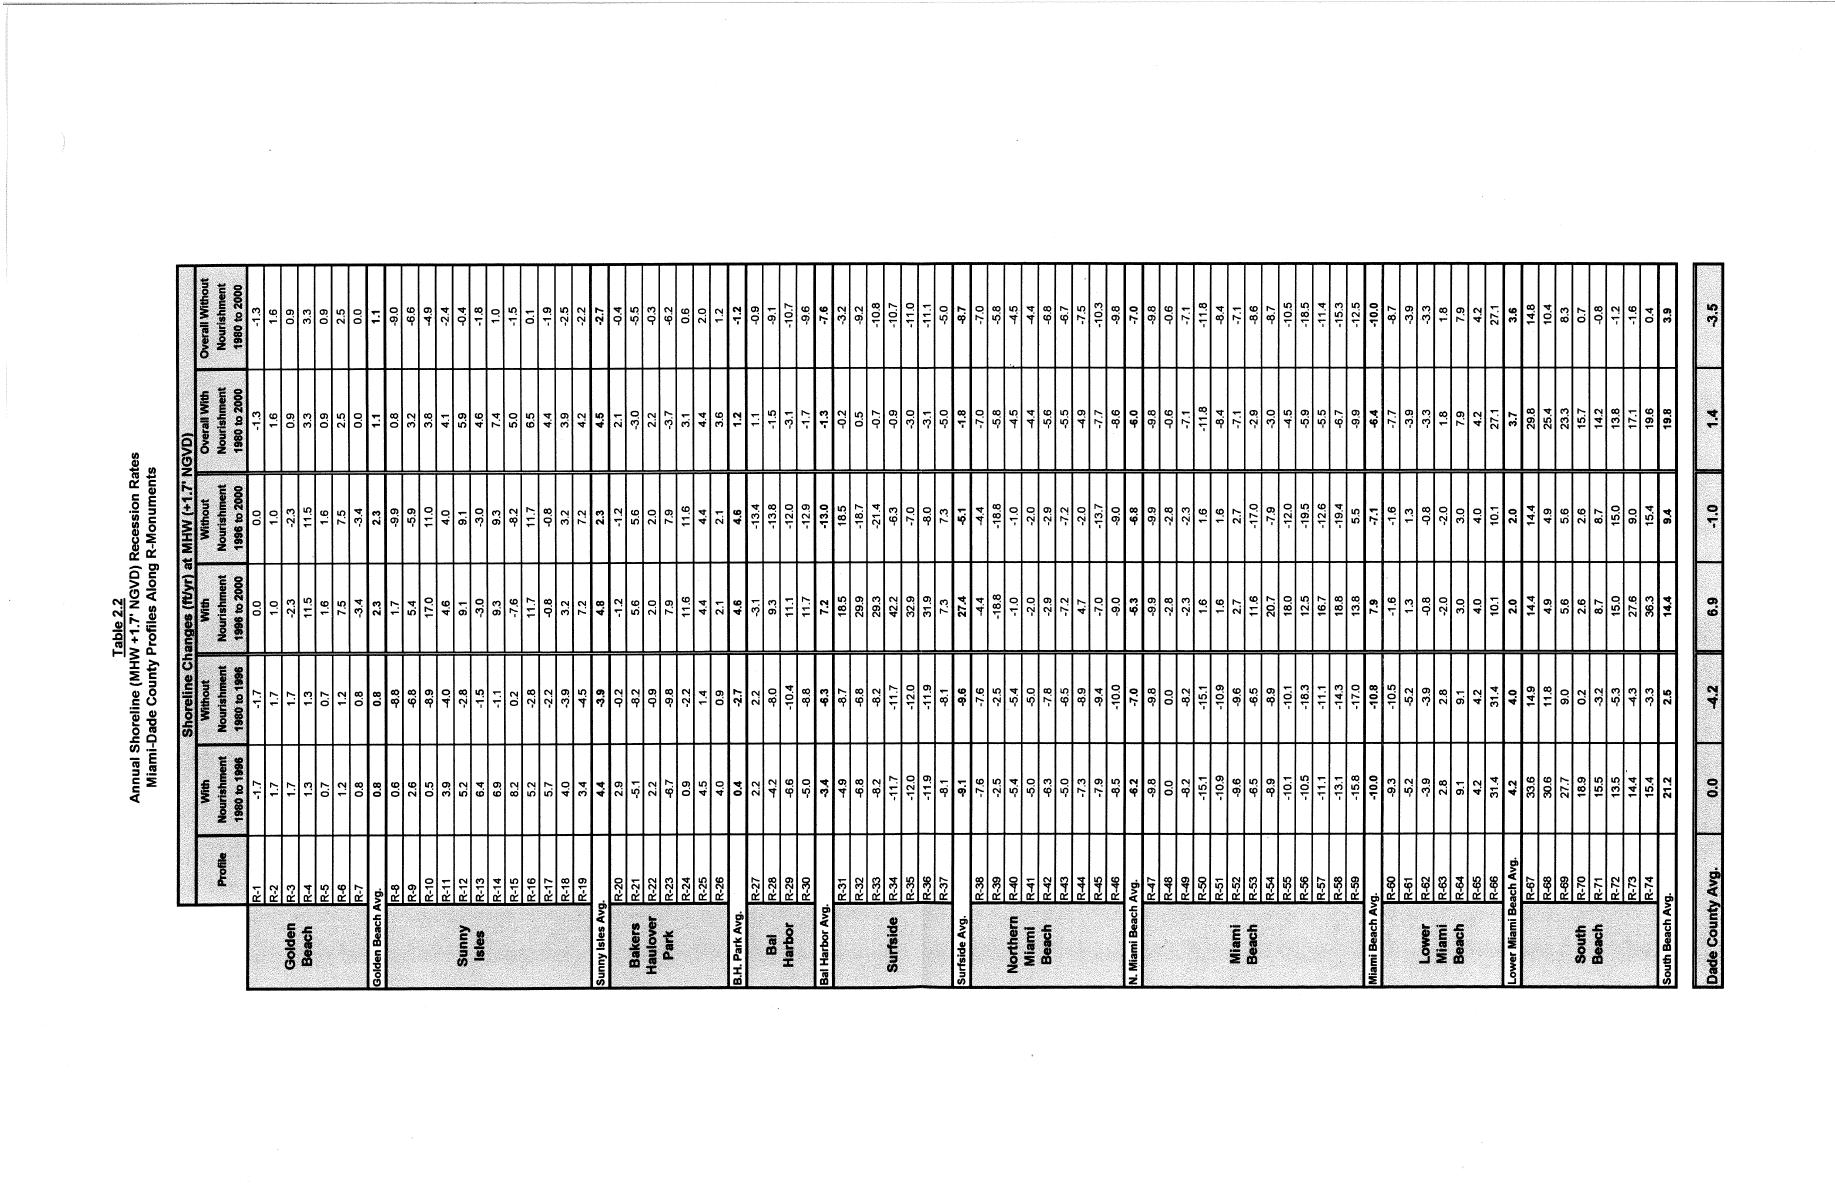
> Table 2.2 Annual Shoreline (MHW +1.7" NGVD) Recession Rates Miami-Dade County Profiles Along R-Monuments
Table 2.1 Shoreline (MHW +1.7" NGVD) Change Comparison Miami-Dade County Profiles Along R-Monuments
Figure 2.1 MHW Shoreline Change - 1980 to 1996 63rd Street Erosional Hot Spot Study
CESAJ_Analysis_sec227
Page Navigation
10
11
12
13
14
15
16
17
18
19
20


 Previous Page
