Home
Download PDF
Order CD-ROM
Order in Print
Home
>
Coastal and Hydraulics Laboratory Fact Sheets
>
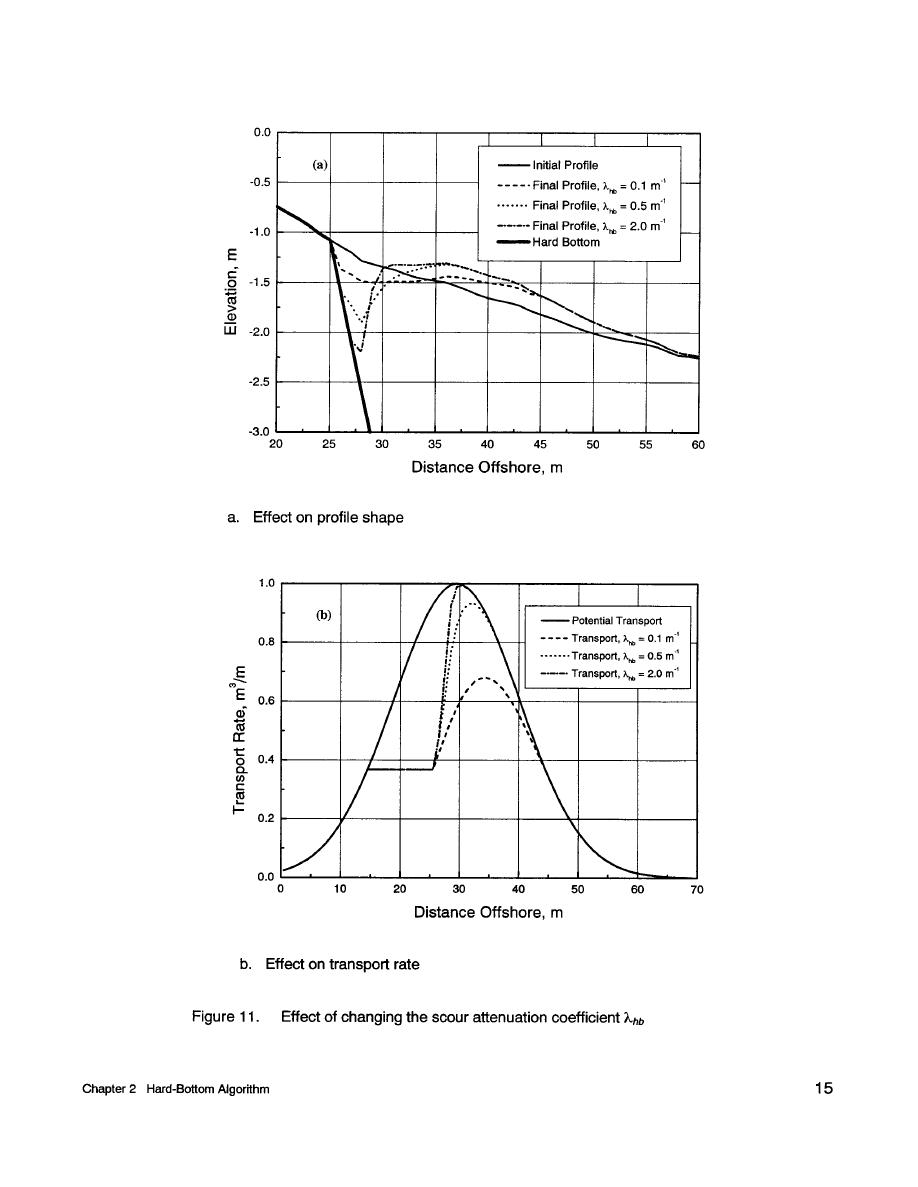
> Figure 11. Effect of changing the scour attenuation coefficient λhb
Figurer 10. Sample calculation with one positive and one negative peak and initially exposed HB between 10 and 20 m and 40 and 50 m
Sample Calculations with the Hard-Bottom Algorithm (cont.) - 9_sbeachr50024
9_sbeachr5
Page Navigation
10
11
12
13
14
15
16
17
18
19
20


 Previous Page
