
| Tweet |

Custom Search
|
|

|
||
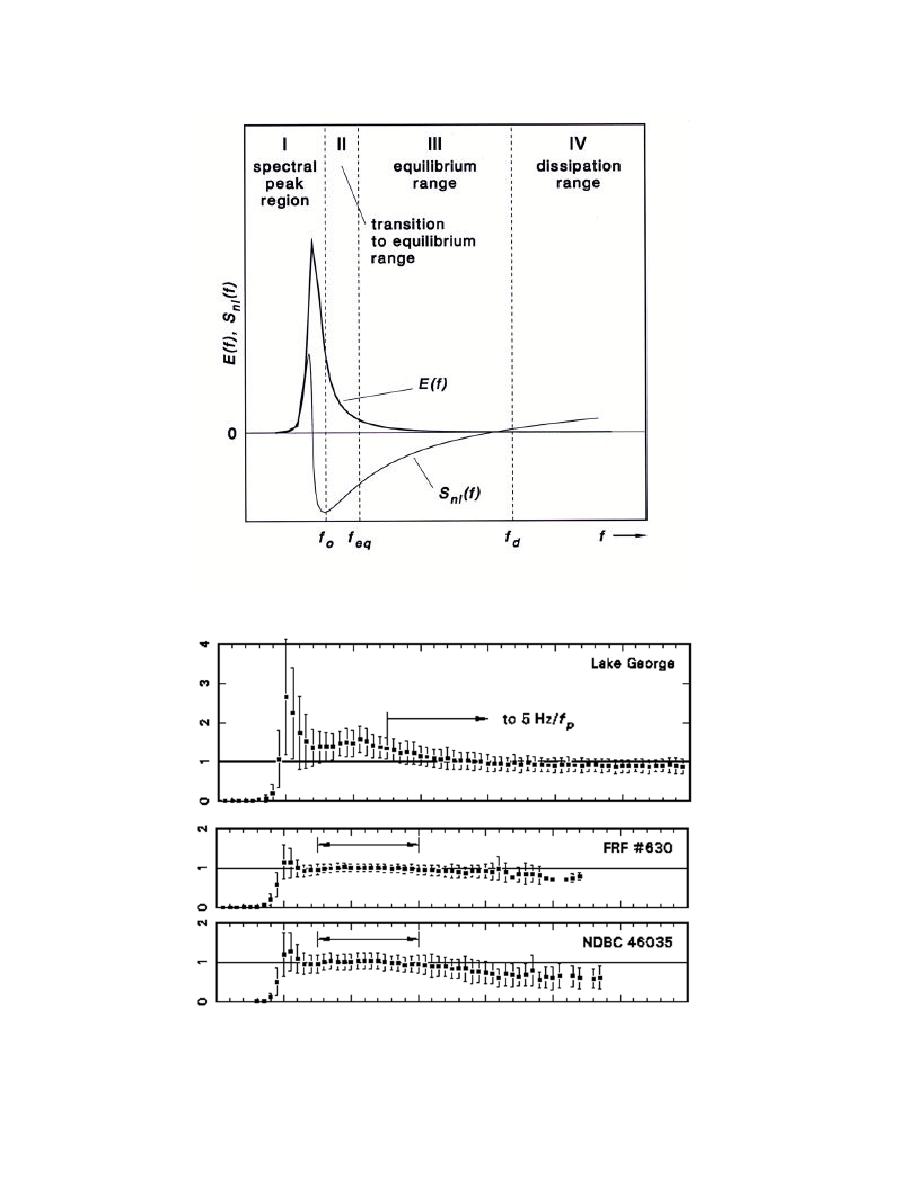 Figure 4. Schematic of diagram for spectral energy-flux regions.
Figure 5. Behavior of spectral density at data site.
|
 |
|
|
||


