g
y
1.0
Existing
0.9
Plan
0.8
0.7
0.6
0.5
0.4
0.3
0.2
0.1
0.0
-2
6
14
22
30
Station
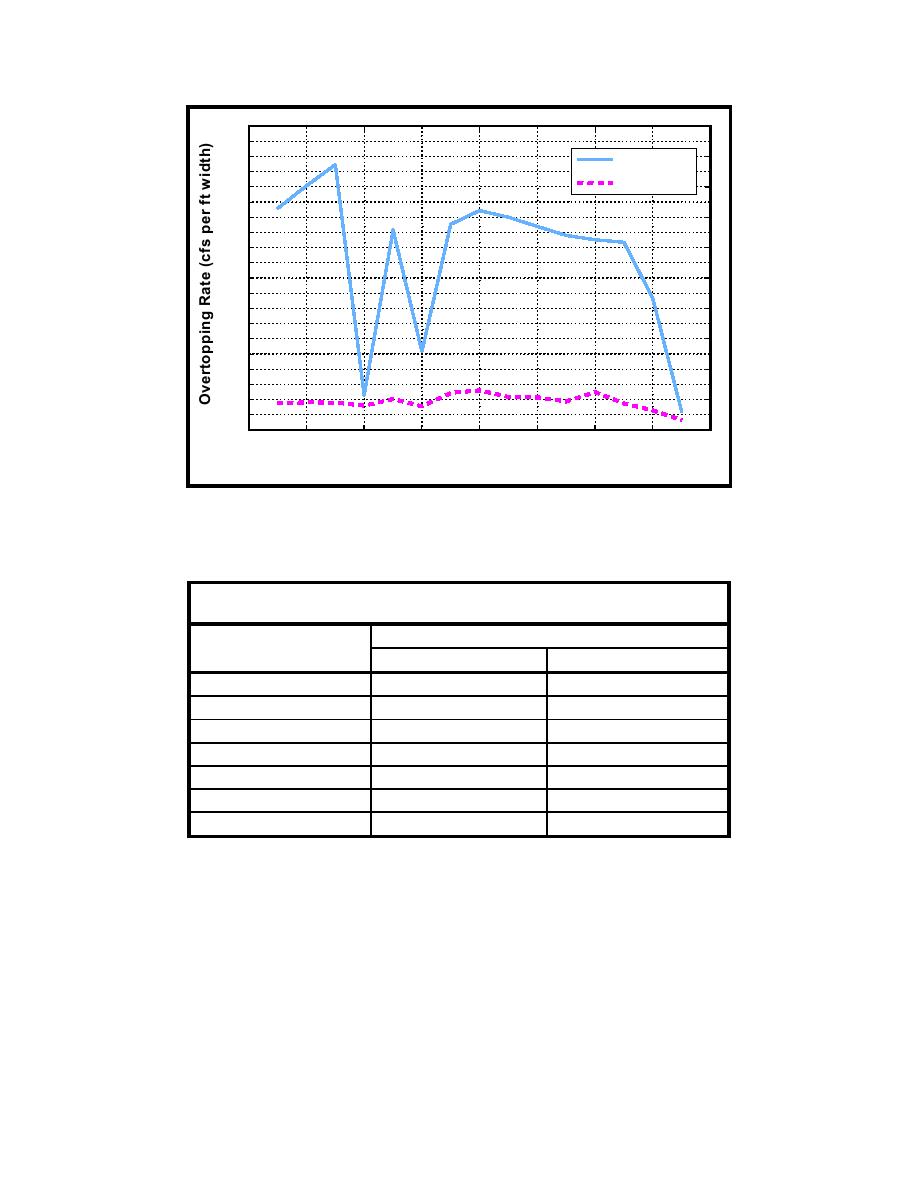
Figure 15. Station overtopping rates, 100-year return period (To convert cubic
feet per second to cubic meters per second, multiply by 0.02831685)
(To convert feet to meters, multiply by 0.3048)
Table 9
Maximum Overtopping Rates along Project Length
Maximum Overtopping Rate, m3 per sec (cfs)
Return Period, year
Existing
Plan
2
0.0 (0.0)
0.0 (0.0)
5
1.03 (36.4)
0.0 (0.0)
10
8.15 (287.7)
0.86 (30.5)
25
25.19 (889.4)
3.11 (110.0)
50
36.68 (1295.4)
5.17 (182.4)
75
45.65 (1612.1)
7.15 (252.6)
100
50.19 (1772.3)
8.18 (288.7)
determining water level along the south side of Cabras Island. For the high total
water level cases, waves are the dominant factor.
In addition to overtopping-frequency information, values of wave parame-
ters, storm surge, ponding level, setup and overtopping rate corresponding to the
peak overtopping event for each storm are presented in Appendix D for each
profile. Wave parameters include significant height, peak period, and approach
direction.
43
Chapter 5
Development of Overtopping and Stage-Frequency Relationships


 Previous Page
