surge is inclusion of tides in the storm-surge simulation. However, this approach
is not practical for stage-frequency analysis because numerous tidal phases
would have to be modeled for each storm in the training set to acquire a repre-
sentative set of surge and tide combinations. An alternative approach was taken
in this study to estimate the combined water-surface elevation of the surge and
tide. Simulations were performed for each of the 30 storms in the training set,
where the swl was taken to be msl. Tides were not included in the computations.
Because storm surges are small for the study site, the water-surface elevation for
the combined surge and tide can be approximated as a linear superposition of the
two. Thus, swl for stage-frequency computations was calculated by addition of
the surge to a specific tidal elevation.
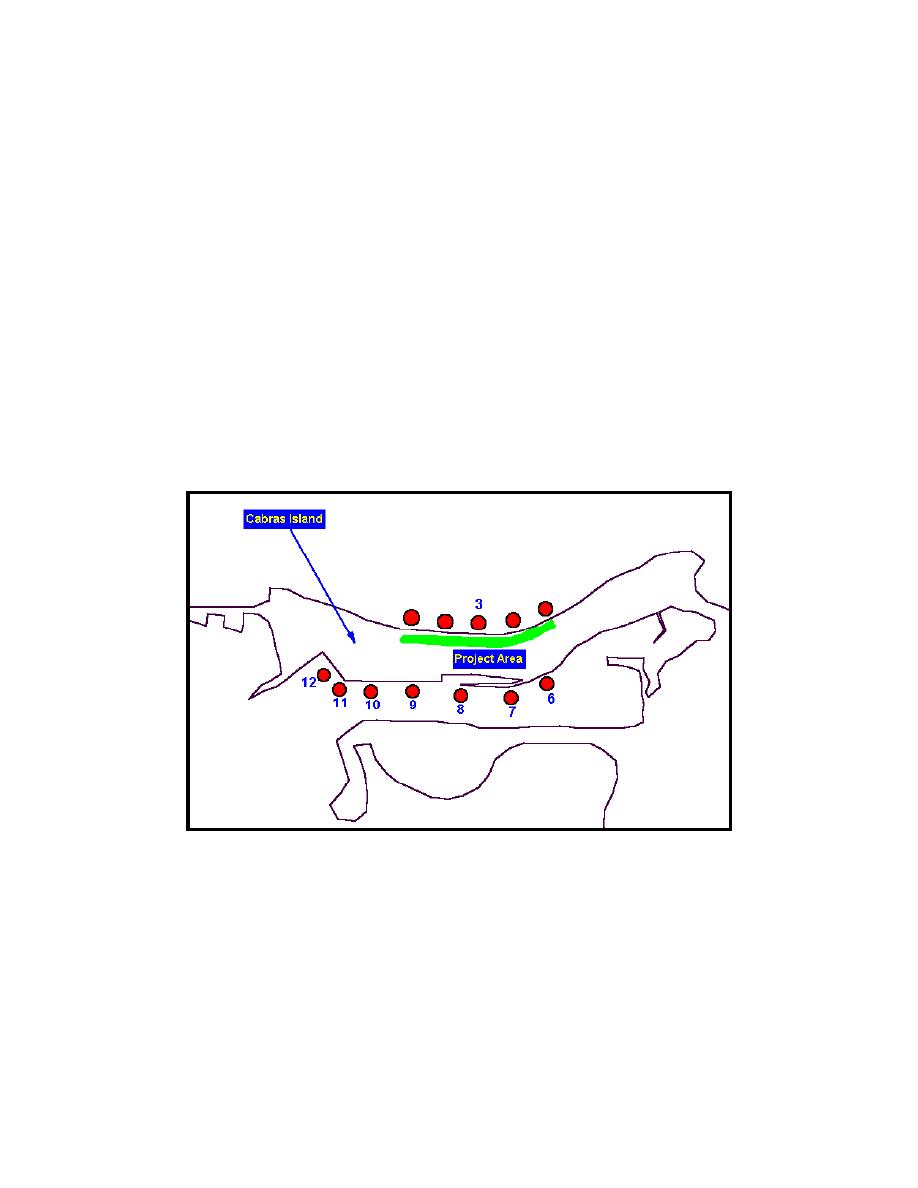
A total of 13 numerical gauge stations was specified as locations for surge
output from the storm-surge model. The stations for both ocean and harbor sides
of Cabras Island are shown in Figure 14. The only numerical gauge station not
shown was as the NOS tide gauge location. Appendix B gives the latitude and
longitude of stations. Water-level values were stored at 15-min intervals at each
station. Combined time-series water-level and wave information were applied for
ponding level, setup, runup, and overtopping calculations.
1
5
2
4
Figure 14. Storm surge station locations for Cabras Island
Spectral Wave Transformation
Waves in the open ocean calculated by the WISWAVE model were trans-
formed to near-breaking by application of WAVTRAN, described in Chapter 3.
Estimates were made of the general nearshore depth contour and shoreline
orientation closest to each of the numerical gauge locations specified in Appen-
dix B. In addition, estimates of sheltering angle bands were made based on
shoreline geometry. For all of the numerical gauge locations, one-sided shelter-
ing was applied.
37
Chapter 5
Development of Overtopping and Stage-Frequency Relationships


 Previous Page
