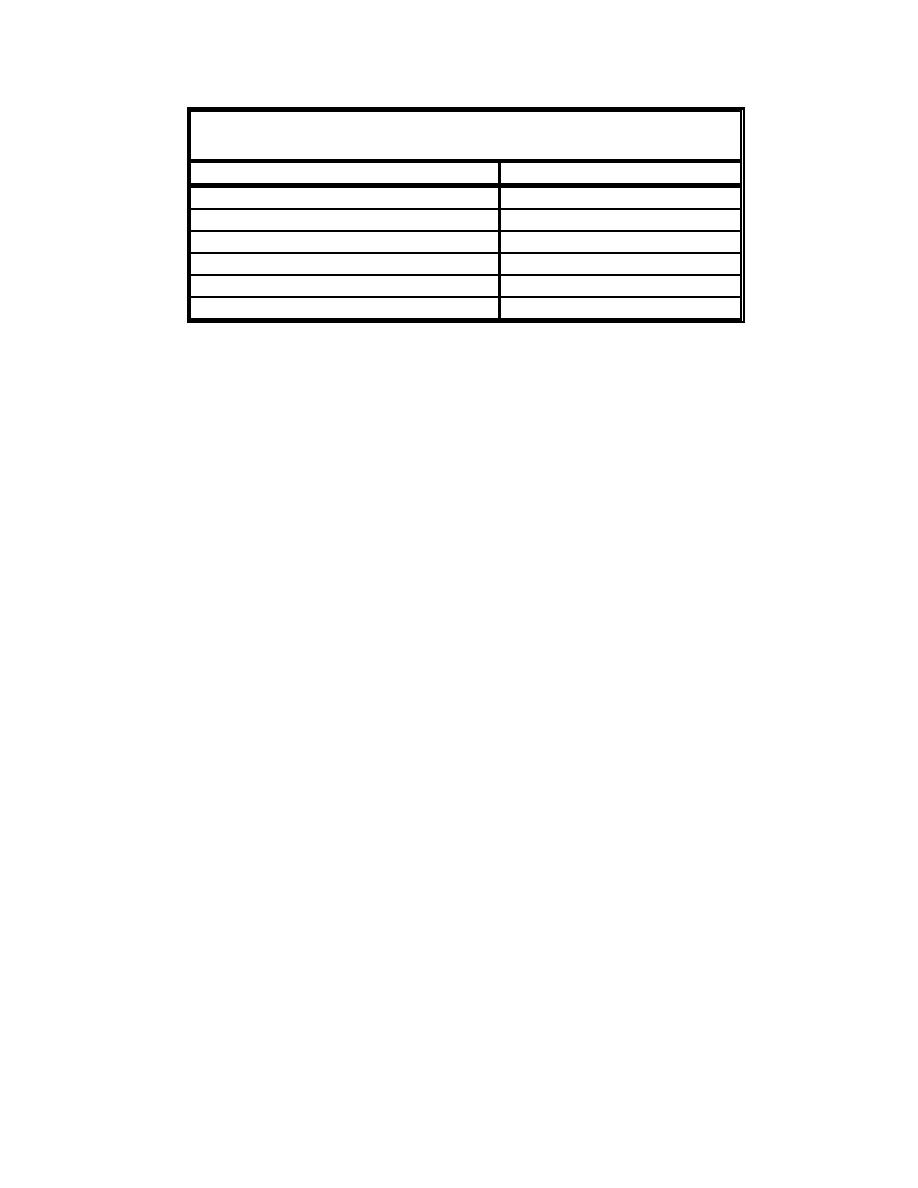
Table 4
WISWAVE Grid Parameters
Parameter
Value
Longitude limits
141.0333 E, 149.0333 E
Latitude limits
10.0333 N, 18.0333 N
Cell side length
0.083 deg
Total number of nodes
9409
Number of nodes in north-south direction
97
Number of nodes in east-west direction
97
Wind forcing for the wave model was calculated by application of the PBL
model, as discussed previously. Wind speed and direction were calculated for
each point on the wave grid at 1-hr intervals.
Deepwater wave parameters calculated by the wave model were stored at
eight stations around Apra Harbor and the west coast of Guam and 24 stations
surrounding Rota for each of the 30 storms in the training set (described in Chap-
ter 2). A list of these stations is given in Table 5. The duration of wave simula-
tions corresponded to the time coverage of each storm in the JTWC database.
Thus, each storm simulation began when the storm center was well outside the
WISWAVE grid and ended with the storm cell well beyond the grid. Wave
parameters were stored at 1-hr intervals.
Deepwater waves produced by WISWAVE were transformed to the study
area by application of the nearshore wave transformation model WAVTRAN
(Jensen 1983; Gravens, Kraus, and Hanson 1991). The WAVTRAN model cal-
culates spectral transformation of waves during propagation from one depth to
another shallower depth, taking into account shoreline orientation and wave
sheltering. The model assumes that sea and swell waves have an energy spec-
trum that follows the Texel, MARSEN, ARSLOE (TMA) spectral form (Bouws
et al. 1985). Directional spread is calculated by 4th and 8th power cosine func-
tions. Wave transformation calculation is dependent on the shoreline orientation
because bottom contours are assumed parallel to the shoreline. If wave sheltering
is included, waves coming from directions specified by a sheltered angle band
are deleted from the spectrum. Details of the model application for this study are
given in Chapter 5.
Wave Runup and Overtopping
In the project area along the north side of Cabras Island, the present study
differs from previous CHL studies in two important ways. First, the primary
study result is a rate of overtopping of the existing seawall, whereas previous
studies have only been concerned with water levels and, in some cases, runup
elevations on a continuous nearshore profile. Second, plan nearshore profiles
include a low-crested berm designed specifically to reduce overtopping.
18
Chapter 3
Modeling Approach


 Previous Page
