
| Tweet |

Custom Search
|
|

|
||
 511
508
503
8
507
50
506
9
DR
50
504
A
T
5
VIS
Reach 2
50
502
445
440
A
N
503
OLA
S
430
501
420
416
435
475
419
412
423
420
415
421
410
Reach 3
414
411
406
415
417
408
409
402
411
407
407
403
405
CLIFF
ST
371
370
301
372
367
371
367
364
363
366
373
365
367
361
358
362
354
365
355
361
357
354
358
350
361
357
349
355
348
348
354
357
345
351
347
6
342
34
353
346
-
347
341
344 -10
itas
336
336
ncin
342
347
ach
E
343
337
a Be
332
341
n
336
Sola
339
Reach 4
333
328
332
337
333
324
327
326
327
0
325
CL
32
322
321
AR
6
31
319
K
318
9
315
31
311
9
31
312
309
ST
5
31
309
308
304
1
31
301
304
9
30
274
LA
L
269
ESTRE
305
264
205
265
265
248
261
259
239
242
255
237
253
236
252
249
1 inch equals 200 feet
233
250
230
244
232
239
Feet
245
-268
227
0
50 100
200
300
400
226
241
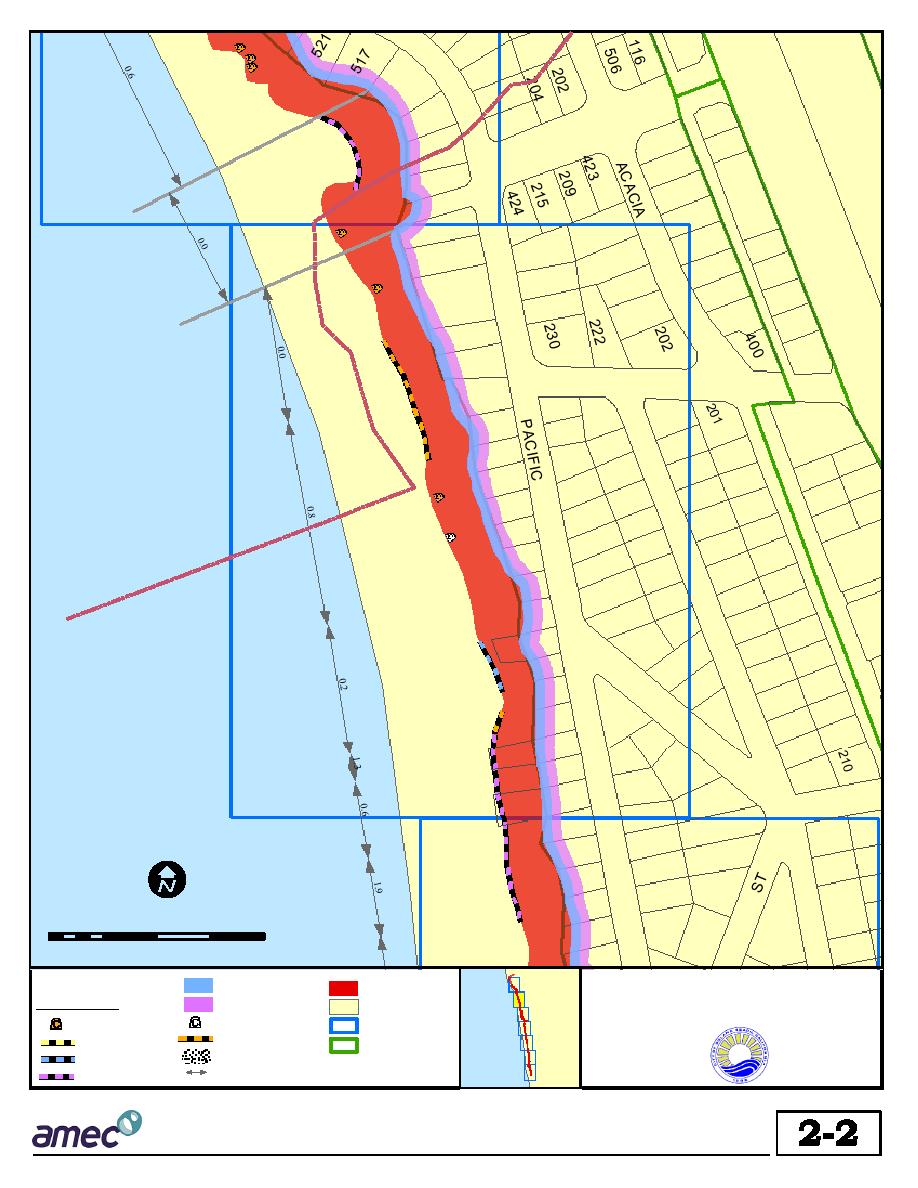
Solana Beach
LEGEND
50 Year Setback Line
Slope
Shoreline and Coastal Bluff
Protective Devices
100 Year Setback Line
Parcels
Management Strategies
Unfilled Sea Caves
Filled Sea Caves
Map Index
Notch Fill
Revetment
General Planning
Cobble Beach
Zoning Boundary
Rock Bolts
Average Erosion Rate
Seawall
within Reaches (ft/year)
Source: City of Solana Beach GIS Database
FIG U R E
Existing Shoreline Protection and Estimated Setback Lines as of 1997
3/17/02
gis1/proposals/solana/plots/fig_A.mxd
|
 
|
|
|
||


